Posts

AMOLED Display Market Track, just issued – Market Performance, Market Forecast, ASP, Supply and Demand Analysis

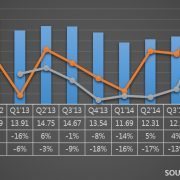
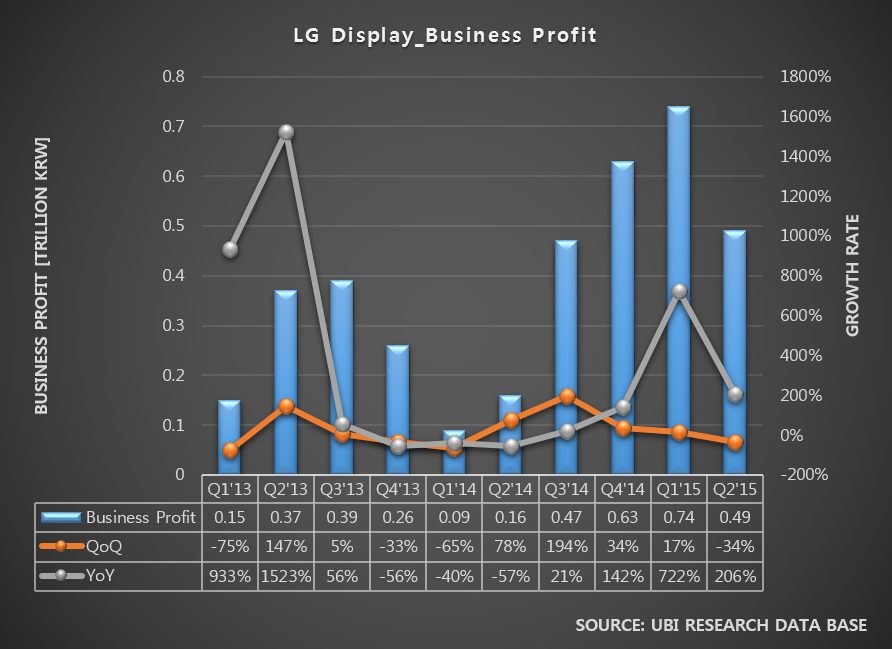
According to the market performance data of the AMOLED Display Market Track published by UBI Research in February 2018, total AMOLED shipments and sales in 2017 were recorded as 440 million units and US$ 27.1 billion, up 13.6% and 62.3% respectively, compared to the previous year.

The number of AMOLED smart phone shipments grew to 95.1% in the total AMOLED market in 2017, and its market share for the revenue was 89.7%. The number of shipments of flexible AMOLEDs reached 140 million units in 2017, increased by 2.1 times compared to the previous year.  Analysis shows that shipments of flexible AMOLEDs will reach 230 million units by 2018, with a share of 46%.

AMOLED shipments for TVs grew by 1.8 times YoY to 1.72 million units in 2017, and the AMOLED market for TV is expected to continue to grow, as LG Display’s 8 G plant in China is scheduled to start operation from 2H 2019.

<Overall AMOLED Market Forecast>

From 2018, AMOLED market is forecasted to change significantly.

In terms of supply, shipments of displays are projected to decline compared to the global capacity of display makers due to the accelerated increase in the size of AMOLED panels and Samsung Display’s shift of rigid AMOLED lines into automotive and foldable applications.

In terms of demand, the demand growth for AMOLED panels for smartphones is expected to decrease. In 2018, demand for flexible AMOLED panels for Chinese set makers is expected to decrease due to the introduction of low-priced full screen LCDs and rising prices of flexible AMOLED panels.

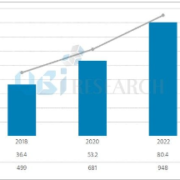
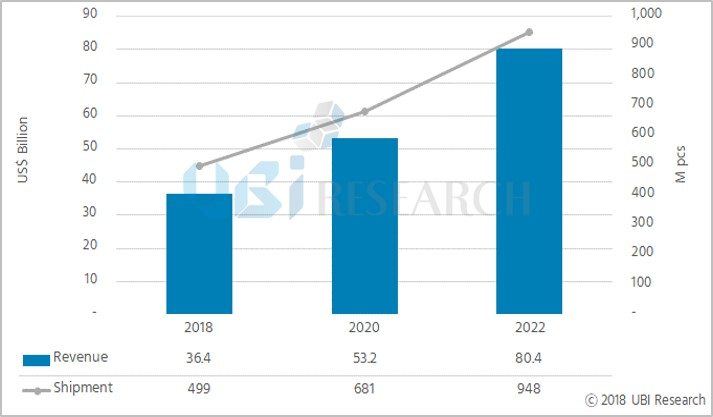
According to the market forecast data of AMOLED Display Market Track, the total AMOLED shipment market is expected to grow at a CAGR of 17.5%, reaching 995 million units in 2022. The revenue is projected to grow at a CAGR of 22%, forming a market of US$ 80.5 billion in 2022.

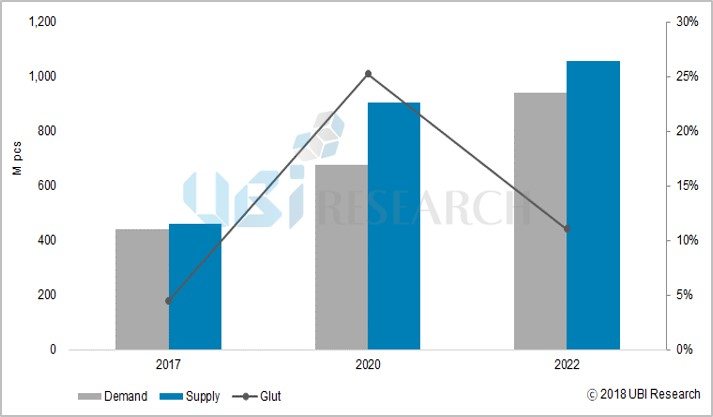
<Small and Medium sized AMOLED, Supply and Demand Analysis>

According to Yi Choong-Hoon, CEO of UBI Research, “20% oversupply is expected to occur by 2021, however, since then, panel prices have fallen due to the entry of Chinese panel makers into the flexible AMOLED market, and oversupply will decrease by 11% in 2022 “.

Meanwhile, AMOLED Display Market Track, which was published on February 12, 2018, covers AMOLED market performance and forecast by quarter, year and application. It also provides data and graphs analyzed in various aspects such as ASP and supply & demand analysis.

From bezel-less to full-screen, Full-screen smartphone’s era has come closer.

The area of display for a smartphone is getting wider.

The display area (hereinafter as D.A.) indicates the display size versus a set size. At the IMID 2016 business forum, the chief of Samsung Display, Park, Won-sang said that “The D.A. may be a core element to overcome the limit of its size through the portability of a smartphone.” and, “henceforth, the full-screen smartphone with more than 90% of D.A. will be released and take the lead the market.

<Samsung Display’s New Product>

The D.A. of an existing smartphone has been about 60-70%.

However, Samsung Electronics has enlarged D.A. over 75% by launching of Galaxy S7 Edge and Note 7 applied flexible AMOLED in 2016. Several companies in China have similarly started the enlargement of the D.A. through Nubia Z11 with 75.2% by ZTE and Mi Mix with 83.6% by Xiaomi.

As LG Electronics has applied full vision 5.7 inch QHD+ display by 18:9 at their G6, its D.A. reached to 80.4%. It was increased 0.4 inch compared to the former G5’s display size, but the bezel was decreased by 1mm from each side to side. It brings the enlargement about 10% of D.A. as a result.

Additionally, Galaxy S8 and iPhone S8(tentative name) planned to launch in 2017 will be more than 91% of D.A. according to reducing the bezel through up and down as well as side to side, since the models will not have a plan for the home button.

According to this, the smartphone market for full-screen maximized D.A. may lead a market trend for high-end smartphone, and the flexible AMOLED may be expected to take the market of full-screen smartphone forward.

Flexible AMOLED takes the high-flexibility through the plastic panel, it makes easy to realize the full-screen by arranging efficiently diverse modules to a smartphone.

By the “Key issue and Market Analysis for Foldable OLED” report published by Ubi Research in October, it looks forward that a smartphone with full-screen AMOLED type (a type which is minimized bezel area for up and down as well as side to side) will exceed the market share of OLED panel for bezel-less type as about 60% in 2020 from about 17% in 2017.

<A smartphone market share by display type, Source: Ubi Research>

Galaxy S7 and S7 edge Now Available in Pink Gold

Galaxy S7 and S7 edge Pink Gold(Source : Samsung Elec.)

Samsung Electronics has released Pink Gold editions of the Galaxy S7 and S7 edge, bringing the total of available colors for the devices to five. Debuting in Korea on April 20, the Pink Gold Galaxy S7 and S7 edge will soon be available for customers in select markets.

Pink Gold was chosen as it, like the other colors available for the  S7 and S7 edge, is a natural color that provides a sense of comfort. These hues glitter and shimmer as if illuminated from inside their glass surfaces.

In particular, the refined, skin tone-inspired Pink Gold color scheme is intended to soothe and incorporate a touch of gentleness, radiance and sophistication to the smartphones’ design.

As well as Pink Gold, the S7 and S7 edge are available in a choice of Black Onyx, Gold Platinum, White Pearl and Silver Titanium.

[Analyst Column] Korean Display Industry Is On Descent

Dr Choong Hoon Yi, UBI Research Chief Analyst, ubiyi@ubiresearch.co.kr


The analysis of 2015 2Q results of Samsung Display and LG Display shows clear indication that Korean display industry is on descent.


[2015 Q2 Korean Display Total Sales Analysis]

According to the results announcement of the 2 companies, the total of 2015 Q2 sales is approximately US$ 11,000,000,000. Compared to the total sales in 2013 Q2 which was US$ 13,000,000,000, Korean display industry trend is exhibiting clear downward tendency.

0812 graph1


2015 Q2 Korean display sales records -4% QoQ, and 8% YoY.

0812 graph2


The main reason for the decrease in sales is Samsung Display’s deterioration of earnings results. While LG Display’s sales of the past 3 years remain fairly consistent but Samsung Display’s sales is gradually decreasing.

0812 graph3


[2015 Q2 Korean Display Total Business Profit Analysis]

Connecting the high points of the total of 2 companies’ business profit reveal that the business value is worsening as the trend moves downward. This also is much contributed to Samsung Display’s business profit decrease.

0812 graph4


[Samsung Display and LG Display Sales Analysis]

According to the earnings announcement of both companies, Samsung Display and LG Display recorded sales of approximately US$ 5,500,000,000 and US$ 5,600,000,000 respectively. LG Display is maintaining higher sales results compared to Samsung Display for the past 5 quarters. Each company’s QoQ showed to be -4% (LGD) and -3% (SDC) and YoY to be 12% (LGD) and 5% (SDC). The simultaneous decrease of QoQ sales of both companies demonstrates that the Q3 sales could also fall.


0812 graph5


0812 graph6


[Samsung Display and LG Display’s Competitiveness Analysis]

Looking at the profit/sales graph of Samsung Display and LG Display, it is apparent that Samsung Display showed superior competitiveness until 2013 Q3, but since then LG Display averaged higher.


[Conclusion]

The reason for the downward trend of Korean display industry is analyzed to be the fall of display panel price due to the Chinse display companies’ mass production through aggressive investment. Particularly, in or after 2017 when China’s BOE is estimated to begin Gen10.5 LCD line, LCD panel price will fall even more rapidly. This is forecast to lead Korean LCD industry to suddenly lose competitiveness. For Korean display companies that have immense LCD sales to show positive growth, it is time to expand OLED business that can be differentiated from Chinse display companies.


The only solutions for Korean display industry are OLED investment in large scale and conversion of LCD line to OLED line. At the time of BOE’s Gen10.5 line operation, Korean display companies also should respond with Gen6 flexible OLED investment and early establishment of Gen8 OLED line.

[Analyst Column] LG Display Q2 Earnings Analysis and Signification of Flexible OLED Investment

Dr Choong Hoon Yi, UBI Research Chief Analyst, ubiyi@ubiresearch.co.kr


On July 23, LG Display announced its earnings results at LG Twin Towers in Yeouido, South Korea. LG Display reported that their Q2 sales recorded approximately US$ 5,700,000,000 with business profit of approximately US$ 420,000,000.


Although sales fell by approximately US$ 260,000,000 (-5%) compared to the previous quarter, it was an increase of US$ 620,000,000 (12%) compared to the year before. Business profit showed approximately US$ 210,000,000 decrease (-34%) QoQ, and YoY US$ 280,000,000 increase (206%).


0805 graph1


LG Display’s sales and business profit of Y/Yo (green line) showed U shape of trend of growth in previous 5 quarters but this quarter recorded a fall. It is analyzed that the growth could slow down from 2H 2015.


The drop of the LG display’s Y/Yo growth in this 2Q is much attributed to smartphone market’s slow down and TV market reduction. It is also estimated the panel price reduction due to Chinese display companies’ aggressive investment is reflected.


0805 graph2


For LG Display to stop the degrowth, mass production of products that are differentiated from competition, is urgently needed, away from LCD panel that is LGD’s current major business.


On the day, LG Display’s management announced approx. US$ 900,000,000 investment for Gen6 flexible OLED line in order to lead flexible OLED market. The investment location is Gumi factory. Investment location is Gumi factory with the initial investment of 7.5K. It is expected world’s second flexible OLED exclusive line will established following Samsung Display. It is anticipated that up to 15K will be established for this line.


Considering last year’s LG Display’s business profit was approx. US$ 1,100,000,000, the US$ 900,000,000 flexible OLED investment is very large. The investment decision must have been very difficult. However, the reasons for LG Display’s drastic flexible OLED exclusive line investment are because companies that produce LTPS-TFT LCD (LGD’s existing main market) is increasing, and because Samsung Display is already monopolizing rigid OLED market and therefore difficult to secure market share.


LG Display’s CFO Kim Sang-don explained that flexible OLED Gen6 line investment was decided at the board of directors meeting on July 22, and was made official on the morning of July 23. Kim added that the decision was reached so that LG Display can lead the OLED business in terms of technology and to occupy initial market in foldable and rollable technologies. He also commented the monthly capa. of the flexible OLED line will be 7.5K.


Regarding large area OLED panel, it was emphasized that this year’s panel production target remains to be 600,000 units and 1,500,000 units next year, same as the ones announced during the Q1 earnings results presentation. It was also revealed that 34K, approximately 9K higher than current capa., will be in operation in 2016. Addressing the concern of oversupply of next year’s 1,500,000 units while the OLD TV market is still small, LG Display suggested the solution of increasing the demand by active promotion from the second half of this year.


Despite the fall of mid to large size panels’ sales price, from the enlargement of sets and AIT technology applied sales performance, the business profit of approximately US$ 4,000 million was recorded. This is a 34% decrease compared to the previous quarter but a 199% increase from the same period in 2014. LG Display estimates that the sales will increase in the third quarter due to seasonal factors and panel’s enlargement trend.