AMOLED Display Market Track, just issued – Market Performance, Market Forecast, ASP, Supply and Demand Analysis
According to the market performance data of the AMOLED Display Market Track published by UBI Research in February 2018, total AMOLED shipments and sales in 2017 were recorded as 440 million units and US$ 27.1 billion, up 13.6% and 62.3% respectively, compared to the previous year.
The number of AMOLED smart phone shipments grew to 95.1% in the total AMOLED market in 2017, and its market share for the revenue was 89.7%. The number of shipments of flexible AMOLEDs reached 140 million units in 2017, increased by 2.1 times compared to the previous year. Analysis shows that shipments of flexible AMOLEDs will reach 230 million units by 2018, with a share of 46%.
AMOLED shipments for TVs grew by 1.8 times YoY to 1.72 million units in 2017, and the AMOLED market for TV is expected to continue to grow, as LG Display’s 8 G plant in China is scheduled to start operation from 2H 2019.
<Overall AMOLED Market Forecast>
From 2018, AMOLED market is forecasted to change significantly.
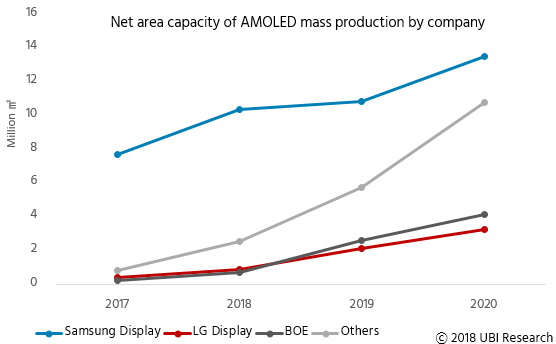
In terms of supply, shipments of displays are projected to decline compared to the global capacity of display makers due to the accelerated increase in the size of AMOLED panels and Samsung Display’s shift of rigid AMOLED lines into automotive and foldable applications.
In terms of demand, the demand growth for AMOLED panels for smartphones is expected to decrease. In 2018, demand for flexible AMOLED panels for Chinese set makers is expected to decrease due to the introduction of low-priced full screen LCDs and rising prices of flexible AMOLED panels.
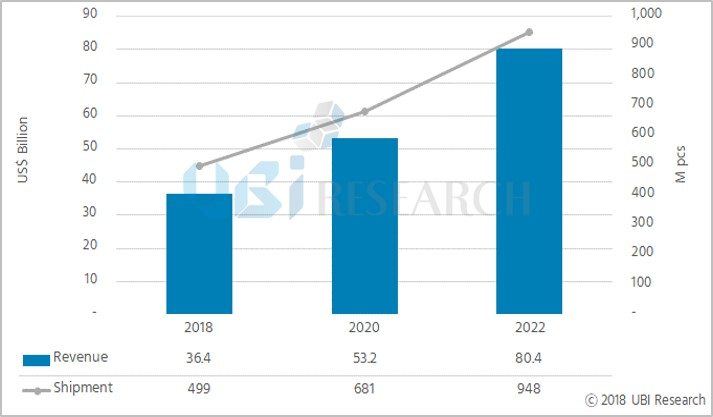
According to the market forecast data of AMOLED Display Market Track, the total AMOLED shipment market is expected to grow at a CAGR of 17.5%, reaching 995 million units in 2022. The revenue is projected to grow at a CAGR of 22%, forming a market of US$ 80.5 billion in 2022.
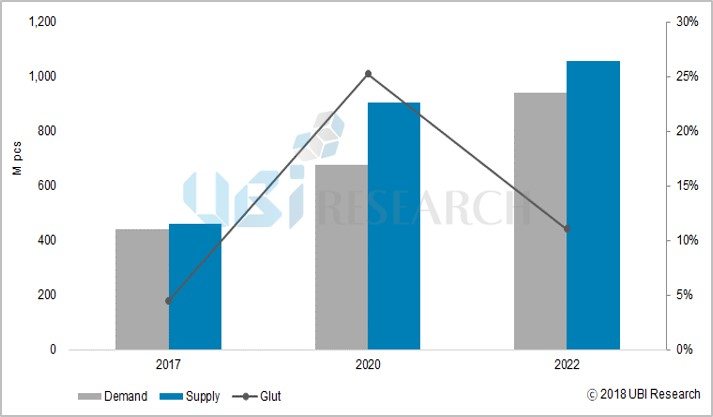
<Small and Medium sized AMOLED, Supply and Demand Analysis>
According to Yi Choong-Hoon, CEO of UBI Research, “20% oversupply is expected to occur by 2021, however, since then, panel prices have fallen due to the entry of Chinese panel makers into the flexible AMOLED market, and oversupply will decrease by 11% in 2022 “.
Meanwhile, AMOLED Display Market Track, which was published on February 12, 2018, covers AMOLED market performance and forecast by quarter, year and application. It also provides data and graphs analyzed in various aspects such as ASP and supply & demand analysis.

