Posts

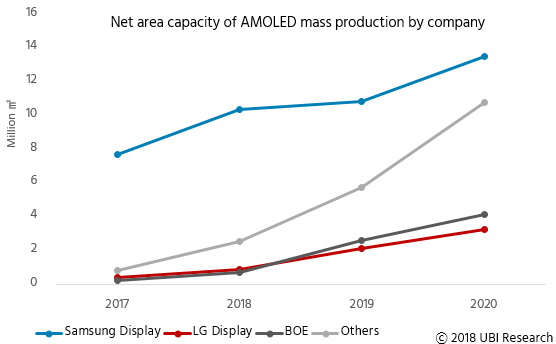
Changes in OLED panel market for smartphones

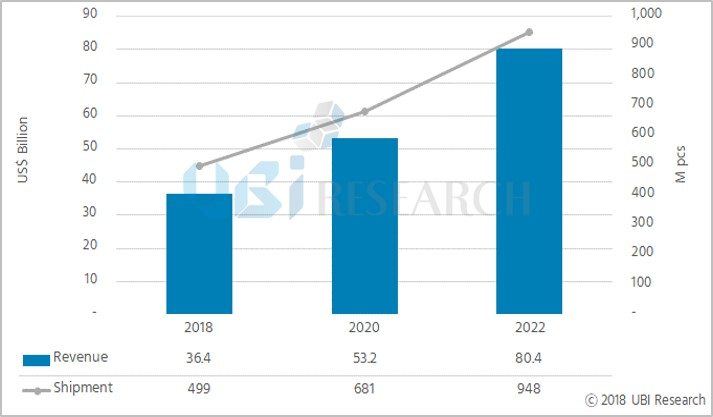
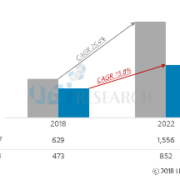
According to the ‘2018 1Q AMOLED Display Market Track’ published by UBI Research, OLED panel shipments for smartphones are projected to grow at an annual average growth rate of 15.8%, from 450 million units in 2018 to 850 million units by 2022. This is a 9.6% decline from the CAGR 25.4% expected in the fourth quarter of 2017.

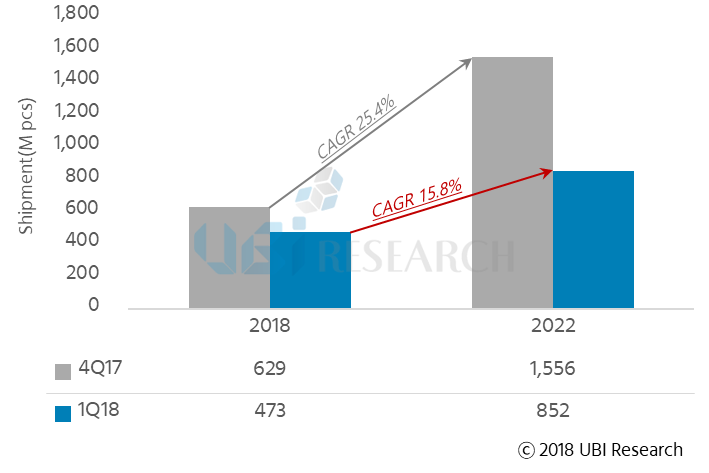
<Shipment forecast of OLED panel for smartphones >

The reason shipment forecast of OLED panels for smartphones is declined compared with 4Q,2017 is because smartphone trends have been reflected recently. The smartphone market is sluggish due to the prolonged replacement period of smartphones and the lack of new technology. In addition, the average size of smartphones has enlarged faster than expected, and the size of smartphones is expected to increase gradually with the anticipation for the launch of foldable OLEDs, leading to a slowdown in the shipment growth.

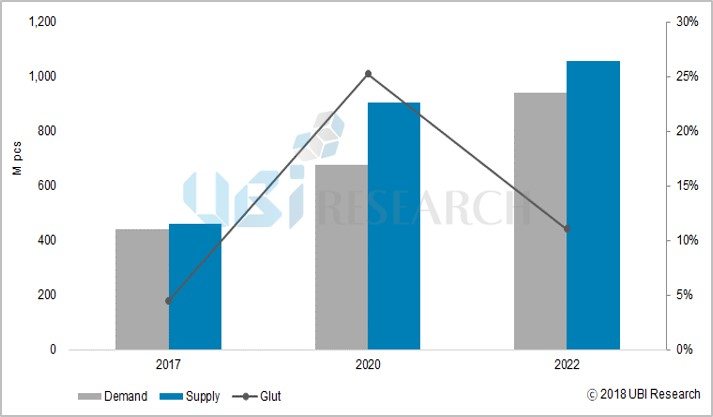
For flexible OLED, ASPs have risen due to the lack of supply, caused by mainly dependent on Samsung Display, and Chinese set makers are burdened by its high prices. As low-priced full-screen LCDs are emerging, it is forecasted that demand for rigid OLEDs will decline since Chinese set makers are adopting more LCDs than OLEDs in rigid smartphones.

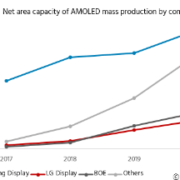
Panel makers in Korea and China have aggressively invested in the Gen6 OLED line in 2016 and 2017. Starting this year, however, they are reviewing the investment and operation time frame of mass production lines, with looking into the smartphone demand. As OLED panels for smartphones account for more than 90% of the total OLED panel market, it is an important factor for the investment flow of panel makers.

Meanwhile, ‘2018 1Q AMOLED Display Market Track’ is based on the market performance data and projected system that UBI Research has accumulated over 15 years. It consists of 8 (eight) modules in total: Panel cost analysis, Market forecast, Supply and demand analysis, Market performance (sales), Competitiveness analysis of panel makers, ASP, Supply chain analysis and investment & Mass production line status.

AMOLED Display Market Track, just issued – Market Performance, Market Forecast, ASP, Supply and Demand Analysis

According to the market performance data of the AMOLED Display Market Track published by UBI Research in February 2018, total AMOLED shipments and sales in 2017 were recorded as 440 million units and US$ 27.1 billion, up 13.6% and 62.3% respectively, compared to the previous year.

The number of AMOLED smart phone shipments grew to 95.1% in the total AMOLED market in 2017, and its market share for the revenue was 89.7%. The number of shipments of flexible AMOLEDs reached 140 million units in 2017, increased by 2.1 times compared to the previous year.  Analysis shows that shipments of flexible AMOLEDs will reach 230 million units by 2018, with a share of 46%.

AMOLED shipments for TVs grew by 1.8 times YoY to 1.72 million units in 2017, and the AMOLED market for TV is expected to continue to grow, as LG Display’s 8 G plant in China is scheduled to start operation from 2H 2019.

<Overall AMOLED Market Forecast>

From 2018, AMOLED market is forecasted to change significantly.

In terms of supply, shipments of displays are projected to decline compared to the global capacity of display makers due to the accelerated increase in the size of AMOLED panels and Samsung Display’s shift of rigid AMOLED lines into automotive and foldable applications.

In terms of demand, the demand growth for AMOLED panels for smartphones is expected to decrease. In 2018, demand for flexible AMOLED panels for Chinese set makers is expected to decrease due to the introduction of low-priced full screen LCDs and rising prices of flexible AMOLED panels.

According to the market forecast data of AMOLED Display Market Track, the total AMOLED shipment market is expected to grow at a CAGR of 17.5%, reaching 995 million units in 2022. The revenue is projected to grow at a CAGR of 22%, forming a market of US$ 80.5 billion in 2022.

<Small and Medium sized AMOLED, Supply and Demand Analysis>

According to Yi Choong-Hoon, CEO of UBI Research, “20% oversupply is expected to occur by 2021, however, since then, panel prices have fallen due to the entry of Chinese panel makers into the flexible AMOLED market, and oversupply will decrease by 11% in 2022 “.

Meanwhile, AMOLED Display Market Track, which was published on February 12, 2018, covers AMOLED market performance and forecast by quarter, year and application. It also provides data and graphs analyzed in various aspects such as ASP and supply & demand analysis.

AMOLED Display Market track – Investment & MP Line Status, just published

According to the investment trend data from AMOLED Display Market Track published by UBI research, the net area capacity of AMOLED production worldwide is expected to grow at a CAGR of 48% from 2018 to 2020.

As a result of analyzing the glass area based on the overall equipment capacity, the net area capacity of AMOLED mass production was 13 million square meters in 2017, and it is expected to grow more than three times to 40 million square meters in 2020.

The net area capacity of AMOLED mass production area is projected to grow from 4 million square meters in 2017 to 8.4 million square meters in 2020, and that of small and medium-sized AMOLED is to be increased about 3.5 times from 9.1 million square meters in 2017 to 32 million square meters in 2020.

Analysis shows that LG Display’s net area capacity will be increased by 6.9 million square meters from 2018 to 2020, followed by Samsung Display with 5.8 million square meters increase and BOE with 4.4 million square meters increase.

On the other hand, when compared to the net area capacity for small and medium-sized AMOLED, Samsung Display is expected to increase by 5.8 million square meters, with the largest investment, followed by BOE of 4 million square meters’ increase and LG Display of 2.9 million square meters increase.

<Net area capacity of AMOLED mass production by company>

According to Lee Choong Hoon, CEO of UBI Research, LG Display’s AMOLED mass production line investment in China will lead LGD to more than double BOE’s AMOLED production capacity in terms of net area capacity in 2020, however, BOE is expected to overtake LG Display at small and medium-sized panel capacity in 2019.

AMOLED Display Market Track consists of investment data, market performance, market forecast, ASP, cost analysis, competitiveness analysis and so on. The investment data in this report contains details of the investment history of the panel companies, current status, and investment prospects for the next three years. Also, the useful data and graphs analyzed in various aspects are provided in excel format.