
AMOLED Display Market track – Investment & MP Line Status, just published
According to the investment trend data from AMOLED Display Market Track published by UBI research, the net area capacity of AMOLED production worldwide is expected to grow at a CAGR of 48% from 2018 to 2020.
As a result of analyzing the glass area based on the overall equipment capacity, the net area capacity of AMOLED mass production was 13 million square meters in 2017, and it is expected to grow more than three times to 40 million square meters in 2020.
The net area capacity of AMOLED mass production area is projected to grow from 4 million square meters in 2017 to 8.4 million square meters in 2020, and that of small and medium-sized AMOLED is to be increased about 3.5 times from 9.1 million square meters in 2017 to 32 million square meters in 2020.
Analysis shows that LG Display’s net area capacity will be increased by 6.9 million square meters from 2018 to 2020, followed by Samsung Display with 5.8 million square meters increase and BOE with 4.4 million square meters increase.
On the other hand, when compared to the net area capacity for small and medium-sized AMOLED, Samsung Display is expected to increase by 5.8 million square meters, with the largest investment, followed by BOE of 4 million square meters’ increase and LG Display of 2.9 million square meters increase.
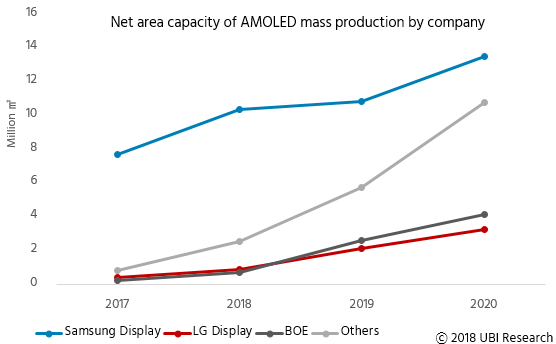
<Net area capacity of AMOLED mass production by company>
According to Lee Choong Hoon, CEO of UBI Research, LG Display’s AMOLED mass production line investment in China will lead LGD to more than double BOE’s AMOLED production capacity in terms of net area capacity in 2020, however, BOE is expected to overtake LG Display at small and medium-sized panel capacity in 2019.
AMOLED Display Market Track consists of investment data, market performance, market forecast, ASP, cost analysis, competitiveness analysis and so on. The investment data in this report contains details of the investment history of the panel companies, current status, and investment prospects for the next three years. Also, the useful data and graphs analyzed in various aspects are provided in excel format.

댓글을 남겨주세요
Want to join the discussion?Feel free to contribute!